

Seeing the “Validation Failed” status in Google Search Console (GSC) is a rite of passage for every web developer, yet it remains one of the most frustrating obstacles in technical SEO.
You submit a fix, wait days for validation, and receive an automated rejection.
Manual debugging often feels like chasing shadows, as the disconnect between search engine reports and backend infrastructure is notoriously difficult to bridge.
Fortunately, the era of relying solely on trial-and-error is over.
By leveraging Gemini AI, you can transform these cryptic error messages into actionable, code-level remediation steps.
This article explores how to bridge the gap between frontend search visibility and backend infrastructure, ensuring your site remains performant, crawlable, and fully optimized within the Google Cloud ecosystem.
Why Manual Fixes Often Fail During GSC Re-validation

Manual troubleshooting frequently falls short because developers treat GSC errors as isolated frontend glitches.
In reality, a “Validation Failed” message often masks deeper systemic issues like inconsistent server responses, stale cache, or outdated SDK versions that do not trigger errors on a standard browser.
When you try to fix a problem without seeing the server-side environment, you often fix only the symptom, like a missing meta tag.
You miss the real infrastructure problem that caused it.
This lack of visibility into your Cloud SQL or Cloud Functions layer often leads to recurring failures, as the underlying configuration remains unchanged.
The Gap Between GSC Error Reports and Actionable Code Fixes
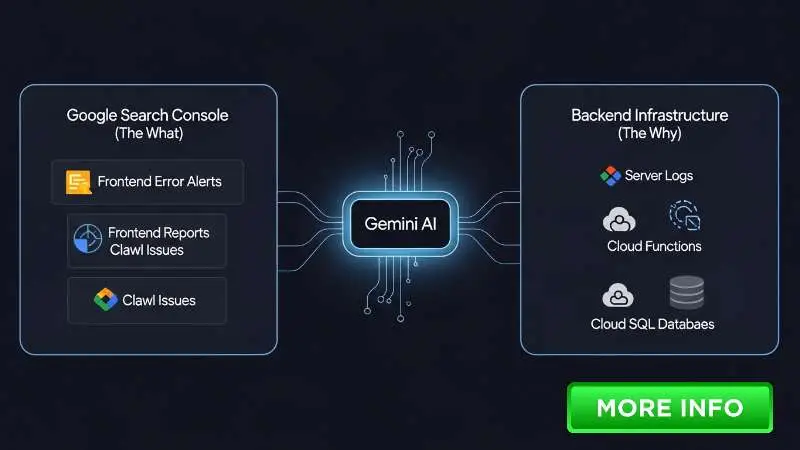
GSC provides the “what” but rarely the “why.” It alerts you to an error message regarding a crawl issue, but it doesn’t cross-reference that issue with your Cloud Functions logs or your Firebase Authentication status.
This data silo creates a gap where developers guess at the cause.
Gemini AI bridges this data silo by correlating frontend reports with backend logs, allowing you to use Cloud Monitoring to visualize latency or connectivity spikes that coincide with Googlebot’s visits.
By connecting these dots, you move from guessing to evidence-based engineering.
How Gemini AI Transforms Web Diagnostics

Gemini AI functions as a force multiplier for technical SEO, changing the way we interpret infrastructure health.
Instead of checking documents by hand, you can give Gemini your stack setup, GSC error examples, and related code.
Gemini finds patterns in thousands of URLs.
It tells the difference between occasional timeouts and ongoing code errors.
It also suggests exact ways to improve your code.
This transforms the diagnostic phase into an intelligent workflow, leveraging tools like Vertex AI to analyze logs across your entire Google Cloud infrastructure.
Accessing Gemini: Gemini Advanced vs. Vertex AI for Developers

To maximize effectiveness, choose the right access point.
Use Gemini Advanced for quick troubleshooting and brainstorming.
Use Vertex AI when you need to build automated monitoring pipelines with your own logs.
Developers who manage complex Google Cloud systems should use Vertex AI.
This helps the model securely access their cloud environment with the right context, ensuring that insights into Cloud Storage, AlloyDB for PostgreSQL, or Realtime Database are accurate and secure.
Gathering Data: Exporting GSC Error Logs and Impacted URLs
Before prompting the AI, gather the raw input.
Export your GSC error reports to a CSV or JSON format.
Ensure you include the specific URL patterns and the exact error message.
By providing Gemini with structured data—such as exported logs from Cloud Monitoring—you move beyond generic advice to tailored solutions that address the specific behaviors of your site architecture.
Contextualizing Your Stack: Defining Your Framework (Node.js, React, or TypeScript) for Gemini
Gemini needs to know your language ecosystem to provide relevant code.
Are you using Node.js for your backend? Is your site a React Single Page Application? Providing this context, alongside your specific REST API endpoints and framework version, prevents the AI from suggesting solutions that might be incompatible with your environment.
Crafting the “Root Cause Analysis” Prompt
The quality of your fix depends on the quality of your prompt.
Use this template: “I am experiencing a [GSC Error Name] on my site.
My stack is [Tech Stack].
Here are the error logs [Paste Logs].
Please analyze these for potential root causes related to server configuration, rendering delays, or outdated library dependencies within Google Cloud Storage or my Cloud SQL for PostgreSQL instances.”
Feeding GSC Error Snippets and Source Code to Gemini
Don’t just paste the GSC error; include relevant sections of your Cloud Functions or your Cloud Firestore queries.
If you suspect an issue with how Googlebot renders your pages, provide the specific component code responsible for data fetching.
Gemini can then check for common pitfalls, such as failing to handle async operations correctly or improper use of dynamic rendering patterns.
Using Gemini to Identify Patterns in Bulk URL Failures
If you have thousands of failing URLs, ask Gemini to group them by error type.
“Based on this CSV of 500 failed URLs, can you identify if the failures correlate with specific dynamic parameters or sub-paths?” This pattern recognition often reveals that the problem is a global REST API configuration issue rather than individual page errors.
Fixing “Crawl Issue: Not Found (404)” at Scale
Often, 404s are caused by improperly handled dynamic links or broken Firebase console routing rules.
Gemini can analyze your configuration to ensure that your catch-all redirects are functioning correctly and that dynamic paths are being properly resolved before the request reaches the server.
Debugging JavaScript Rendering Issues in Single Page Applications (SPA)
Rendering issues often stem from slow execution or unhandled promise rejections in your frontend code.
Ask Gemini to check your React or TypeScript rendering logic for slow points.
These slow points might cause Googlebot to time out before the page finishes loading.
Resolving “Server Error (5xx)” by Analyzing Cloud Functions and Cloud SQL Logs
5xx errors typically indicate that your Cloud SQL instance is under load or your Cloud Functions are hitting cold-start limits.
Provide Gemini with recent logs to pinpoint latency spikes or database connection pooling issues that occur during peak crawl traffic.
Using Gemini to Refactor Faulty JSON-LD Schema Markup
Schema markup failures often arise from inconsistent data formats.
If you get dynamic data from Cloud Firestore, Gemini can create a helper function.
This function keeps your structured data consistent, valid, and following search engine rules, even if some data is missing.
Identifying Latency and Timeout Issues with Cloud Monitoring
Infrastructure performance is a critical factor in crawl success.
Use Gemini to interpret your Cloud Monitoring dashboards.
If you see high latency, ask Gemini: “Based on these latency metrics, is this a bottleneck in my database queries or a delay in the CDN origin response?”
Troubleshooting Firebase Hosting and Dynamic Links Redirection Errors
If your Firebase environment is rejecting traffic, verify your security rules and OAuth configuration.
Gemini can check your security policies.
It makes sure your redirects are not blocked by strict rules that stop Googlebot from reaching important assets.
Using Gemini Cloud Assist to Optimize Server Response Times for Googlebot
Googlebot prioritizes sites with low latency.
Gemini can suggest configuration changes for your load balancers or help you identify which Cloud Functions are the slowest to respond.
By streamlining these processes, you ensure a smoother crawl budget allocation for your site.
Simulating Googlebot Behavior with Gemini-Generated Test Cases
Before you submit for re-validation, ask Gemini to generate a series of test cases.
“Create a test script that simulates a crawler accessing this URL with a non-browser User-Agent, checking for proper header responses and rendered HTML.”
Using Firebase Emulator to Test Fixes in a Sandbox Environment
Use the Firestore Emulator to test your changes in an environment that mirrors production.
This prevents you from pushing code that might introduce new bugs.
Gemini can help you write the necessary test scripts to automate this validation process, ensuring your backend changes are robust before they go live.
Verifying Mobile Usability and Core Web Vitals with AI-Guided Optimization
Gemini can analyze your CSS and image-loading strategies to suggest optimizations for Core Web Vitals.
It can also point out if your Firebase Authentication or Google Analytics scripts are injecting non-essential code that impacts your Largest Contentful Paint (LCP) score.
Creating a Documentation Knowledge Catalog for Your Site’s Common Errors
Document your findings.
Use Gemini to summarize the fixes you’ve implemented into a “Runbook.
” When an error recurs, you can reference this catalog to see if a previously identified fix is still applicable or if you need a new approach.
Setting up Cloud Scheduler for Regular Site Health Audits
Automate your audits using Cloud Scheduler.
You can run a script that exports GSC data and sends it to a Gemini processing pipeline.
This pipeline warns you about possible problems before they become “Validation Failed” errors.
Using Gemini to Write Custom Scripts for GSC API Data Export and Analysis
Don’t rely solely on the GSC interface.
Gemini can write Python or Node.
js scripts that pull data directly from the GSC API, enabling custom dashboards and automated alerts.
This ensures that you are always the first to know about changes in your site health.
Conclusion
The transition from manual troubleshooting to AI-assisted diagnostics is essential for modern web management.
By using Gemini AI to bridge the gap between Google Search Console error messages and your backend infrastructure, you move from reactive maintenance to proactive optimization.
Gemini helps you connect the search engine’s needs with your technical work.
You can use it when debugging Cloud Functions, fixing JSON-LD, or checking Firebase deployment problems.
To maintain your site’s health, monitor your Cloud SQL performance using Cloud Monitoring, leverage Vertex AI Search for data-driven insights, and treat every “Validation Failed” message as an opportunity to improve your architecture.
Start by automating your health checks with Cloud Scheduler and integrating App Check or ReCAPTCHA Enterprise to secure your traffic.
By adopting these AI-first workflows, you ensure your site remains crawlable, performant, and resilient against future indexing challenges.
